Medal Efficiency
As planned, first of all, we did data manipulation before plotting. Golds were given 4 points, Silver 2, and Bronze 1. Attendance without any medals was assigned to 0 point. A country’s “medal efficiency” was calculated as the quotient of total medal points and the total number of athletes participating over 120 years. Therefore, if a country / region has a medal efficiency of 0.5, it means that on average, each athlete of that country / region earned half a Bronze.
We then plotted a choropleth map using orthographic projection. We applied Viridis color map where darker shades denote higher medal efficiency. To ensure interactivity, we made this map with the Plotly package. See Figure 33.
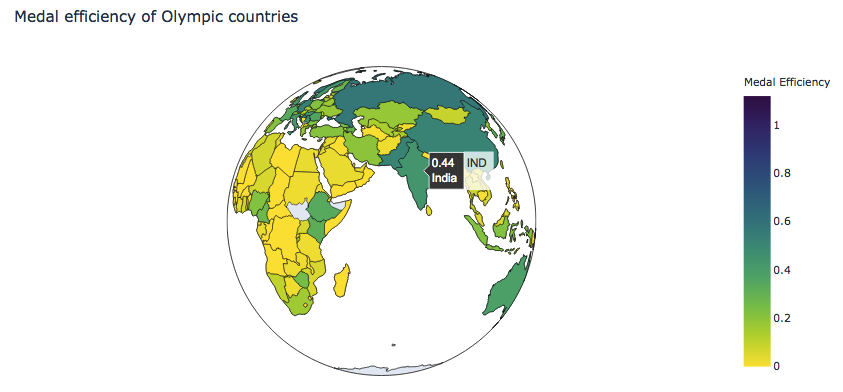
Figure 33: Interactive choropleth for medal efficiency
We found this index both more accurate and intuitive. The reasons why it is more accurate have been outlined above. We believe that it is also more intuitive because, for example, for countries that still exist today, the highest medal efficiency is 0.91 for the United States of America. The fact that the highest is close to one makes it easier to compare between countries.